
Google Analytics basics for beginners
Jessica Baldwin / Updated June 4, 2022
If you're launching a website, you'll want to see how it performs over time. You can monitor your website's performance by installing Google Analytics.
This article covers:
- What Google Analytics is.
- How to set up your account.
- How to add Google Analytics to your website.
- How often you should review your analytics.
- What to look for in Google Analytics.
What is Google Analytics?
Google Analytics is a free tool that helps you understand what people are doing on your website. The information collected by Google Analytics includes things like which pages visitors look at first, where they came from, and how long they stay on each page.
You can use Google Analytics to analyze your website performance. Use these insights to improve your website and marketing strategies.
This guide will walk you through setting up your Google Analytics account and what to look for once you start collecting data from your website.
First, an important note about analyzing your website
Perhaps you've launched a website, and you're not getting many inquiries or sales just yet. You may think that there's something wrong with your website. Maybe your website needs changes, but the more likely culprit is that you're not driving enough traffic with your online and offline marketing. It could be a combination of both, but you won't know if your website is effective if you don't get enough traffic to it in the first place.
People are unlikely to sign up for something from one visit to your website. Is your marketing funnel optimized to engage your audience over time?
When looking at your website numbers, don't put all of the blame or credit on the website. Take a holistic view of all of your marketing activities to optimize your strategy going forward.
How to set up a Google Analytics account
Setting up a new Google Analytics account is easy. Just follow these steps:
1. Go to google.com/analytics.
2. Click "Start for free" at the top right corner of the page.
How to add Google Analytics to your website
You'll set up a property and data stream for your website within the analytics account. Then, you can obtain the code snippet, called a "Global Site Tag," and insert the code on your website. The process varies amongst website platforms. Here are directions directly from Google.
When should you look at your analytics?
Once you've installed Google Analytics on your website, give it some time to collect data. There won't be much to review on the first day it's installed.
Consider looking at your data a couple of times a month or more frequently as needed. For example, if you're running online ads that link to your site, you may want to check in daily throughout the campaign.
Get familiar with the interface.
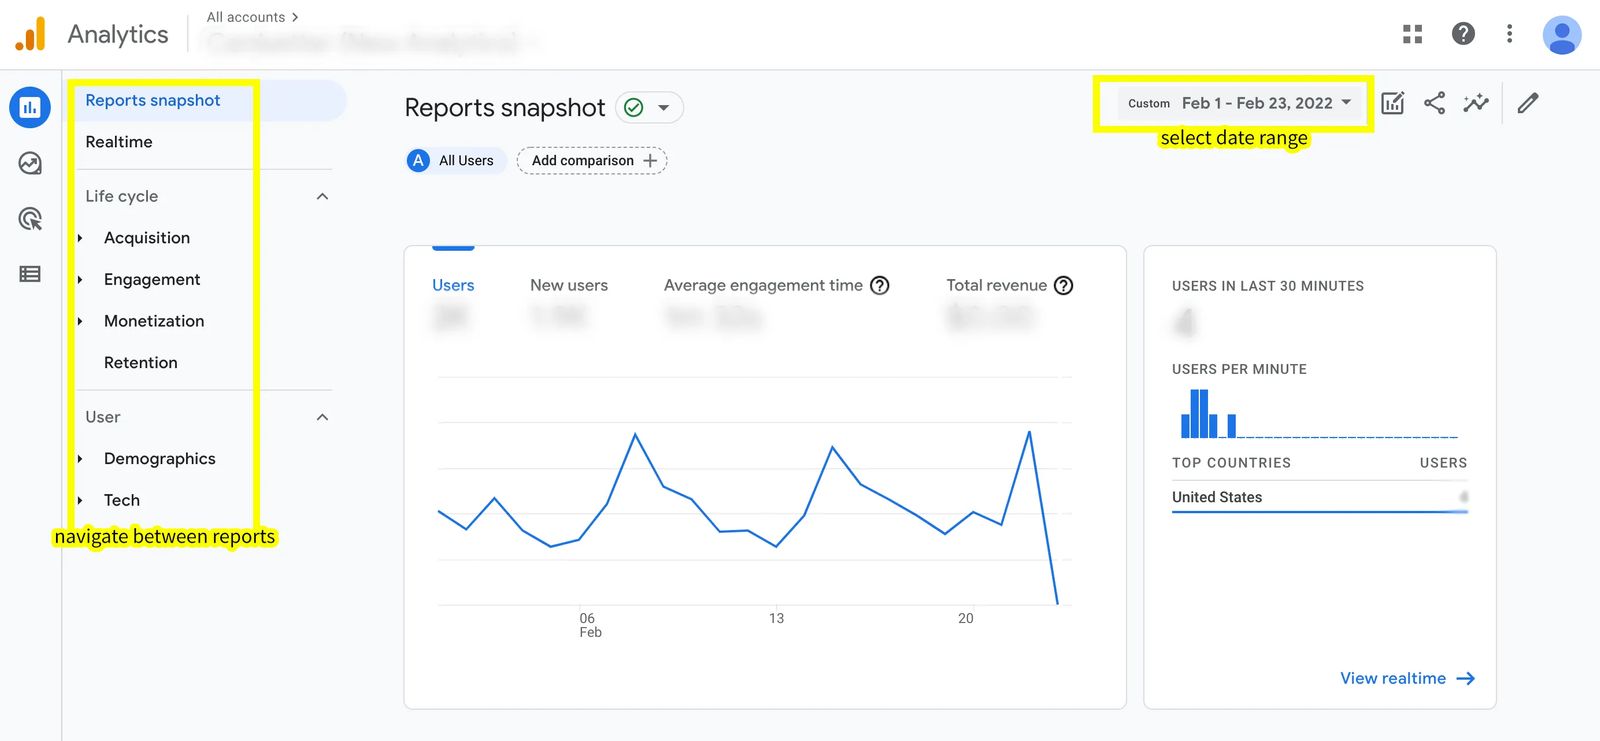
When you log in to Google Analytics, a default date range is set, usually the past 28 days. You can adjust the date range to look at the time period of interest. For example, you can select several weeks or months to see how your traffic has grown over time. You can even compare different periods against one another.
You'll automatically start at the Reports Snapshot dashboard upon logging in. You can see a general overview of your traffic on this screen. When you scroll down the page, you'll also see an overview of traffic sources, popular pages, and more. When you become more familiar with the platform, you can customize your dashboard to get a quick view of your favorite reports.
On the left side of the screen, you can navigate between reports.
What to look for in Google Analytics
What are you looking for in Google Analytics? There's a lot of data you can review within your account. In fact, it can all seem a bit overwhelming. Just remember that at the end of the day, you're trying to answer a few basic questions to determine if your marketing, including your website, is effective.
Am I getting website traffic? Is my traffic growing over time?
First of all, is your website getting traffic? Is it growing over time?
To answer these questions, you'll review the "Reports Snapshot" and take a look at the graph. Expand the date range so you can see how your traffic has performed over the past several weeks, months, or the entire year!
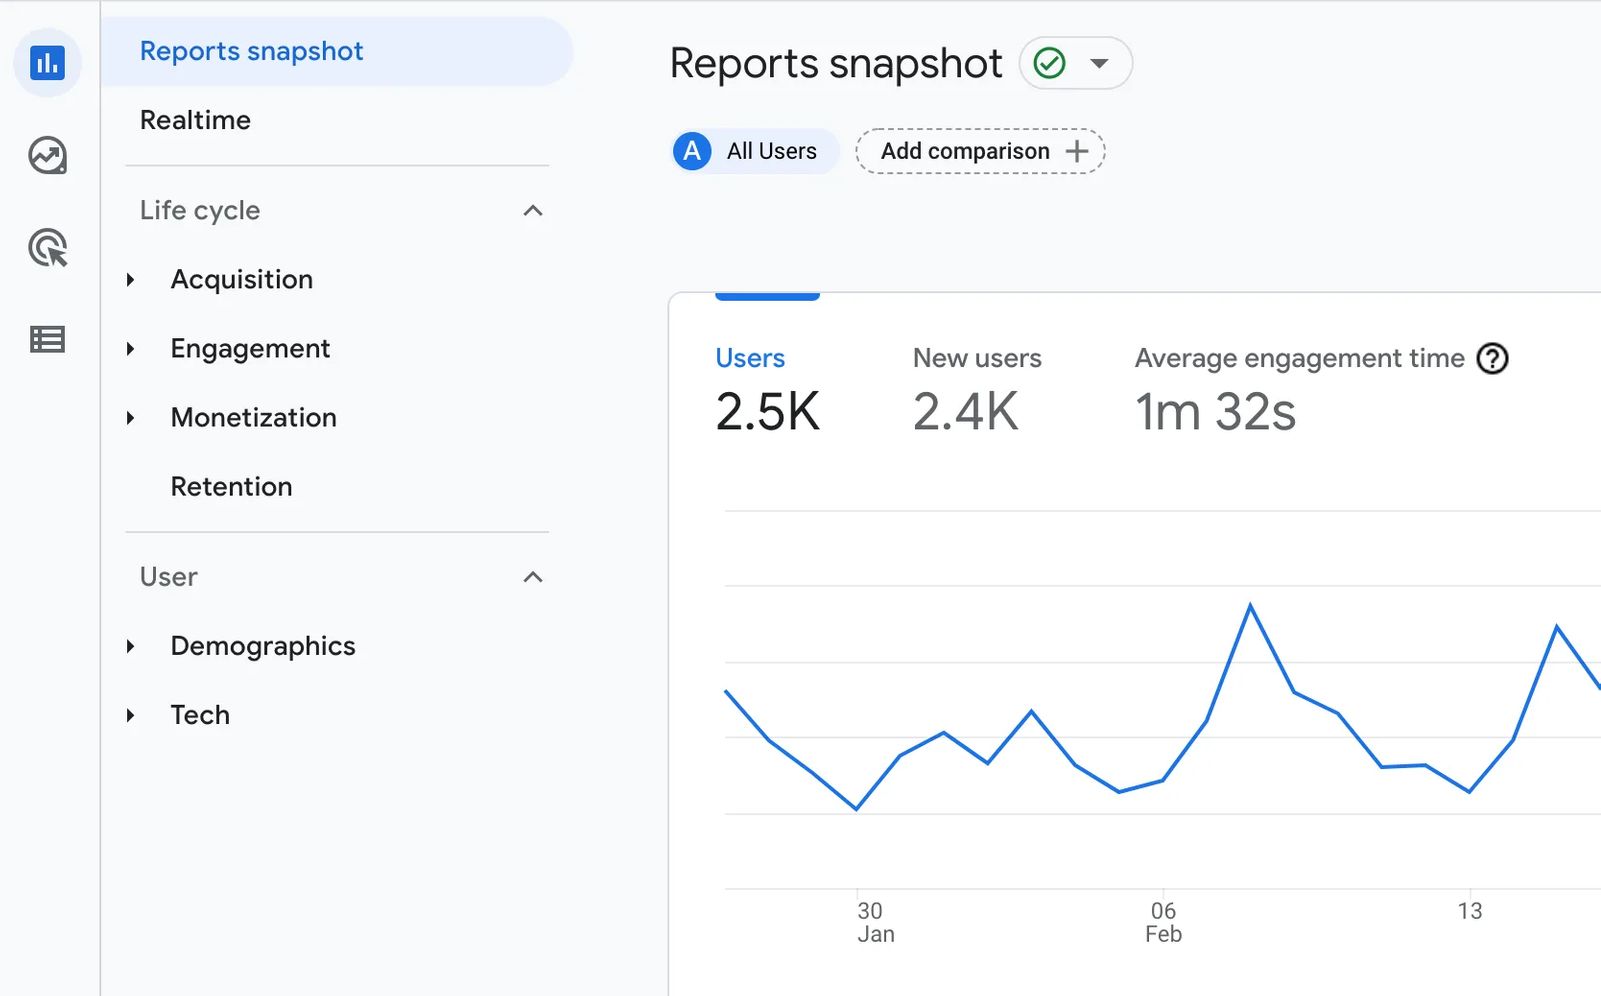
You'll see how many "users" (or visitors) have been to your website and whether or not your traffic is trending upwards.
Note that a brand new website for a brand new business won't have much traffic at first. Once you start getting traffic, it may be relatively inconsistent. Don't panic! As you begin marketing your business, you'll see your numbers grow.
Where is my traffic coming from?
How are people discovering and ending up on your website? Are they getting there through a Google search, from links on your social media accounts, from online ads, or from other websites that link to you? You can discover all of this in Google Analytics.
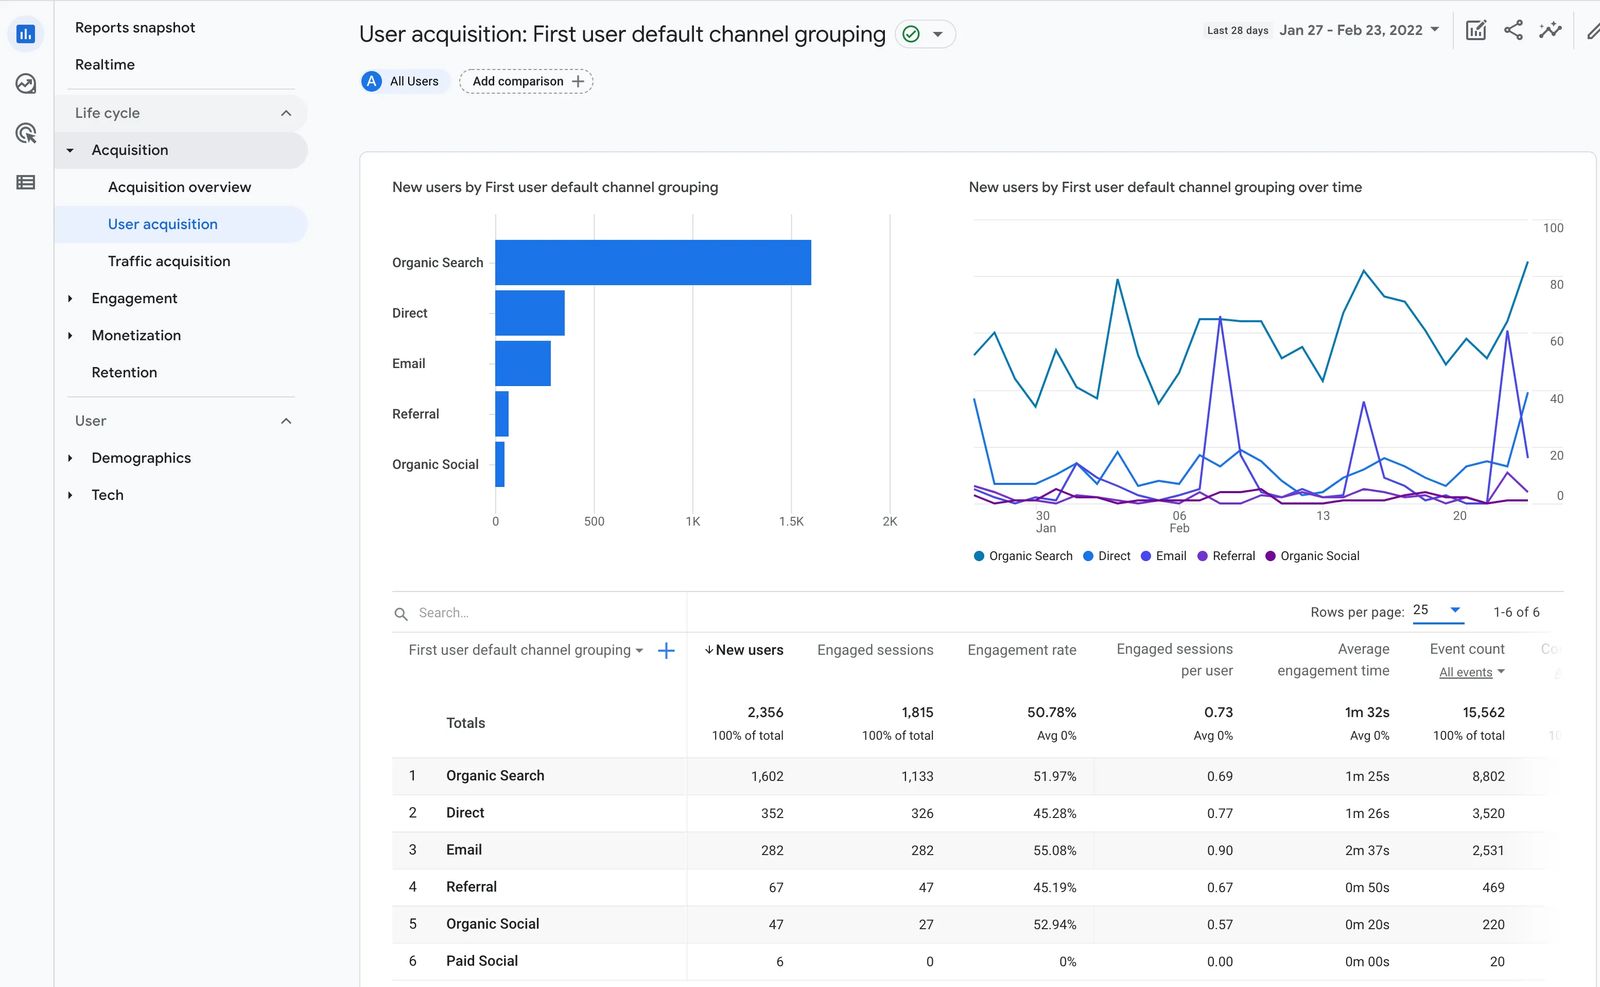
Visit the "User Acquisition" report to uncover this information. It will break down your acquisition channels by:
- Organic search – people who came to your website after performing an online search (in Google, Bing, etc.)
- Direct – people who visited your website by typing your website address directly into their browser
- Email – people who visited your website from your email campaigns
- Paid social – paid advertisements on social media platforms
- Organic social – from social media posts or bio links
- Referral – traffic from other websites that link to yours
How people get to your website is primarily determined by your marketing efforts. If folks find you from search, you're probably investing time in producing optimized content. Direct visits are often the result of traditional radio, print, or television ads. People see or hear your ad and type your address directly in the browser. If you see traffic from organic social, you must be doing a great job with your social media presence.
You can learn about what's working or not working so well and adjust your marketing efforts accordingly.
What are visitors doing on my website?
Where are your website visitors spending time on your site? Which pieces of content are most popular?
Under "Engagement," you'll find a report called "Pages and screens." You can determine which pages people are visiting and how much time they spend with your content.
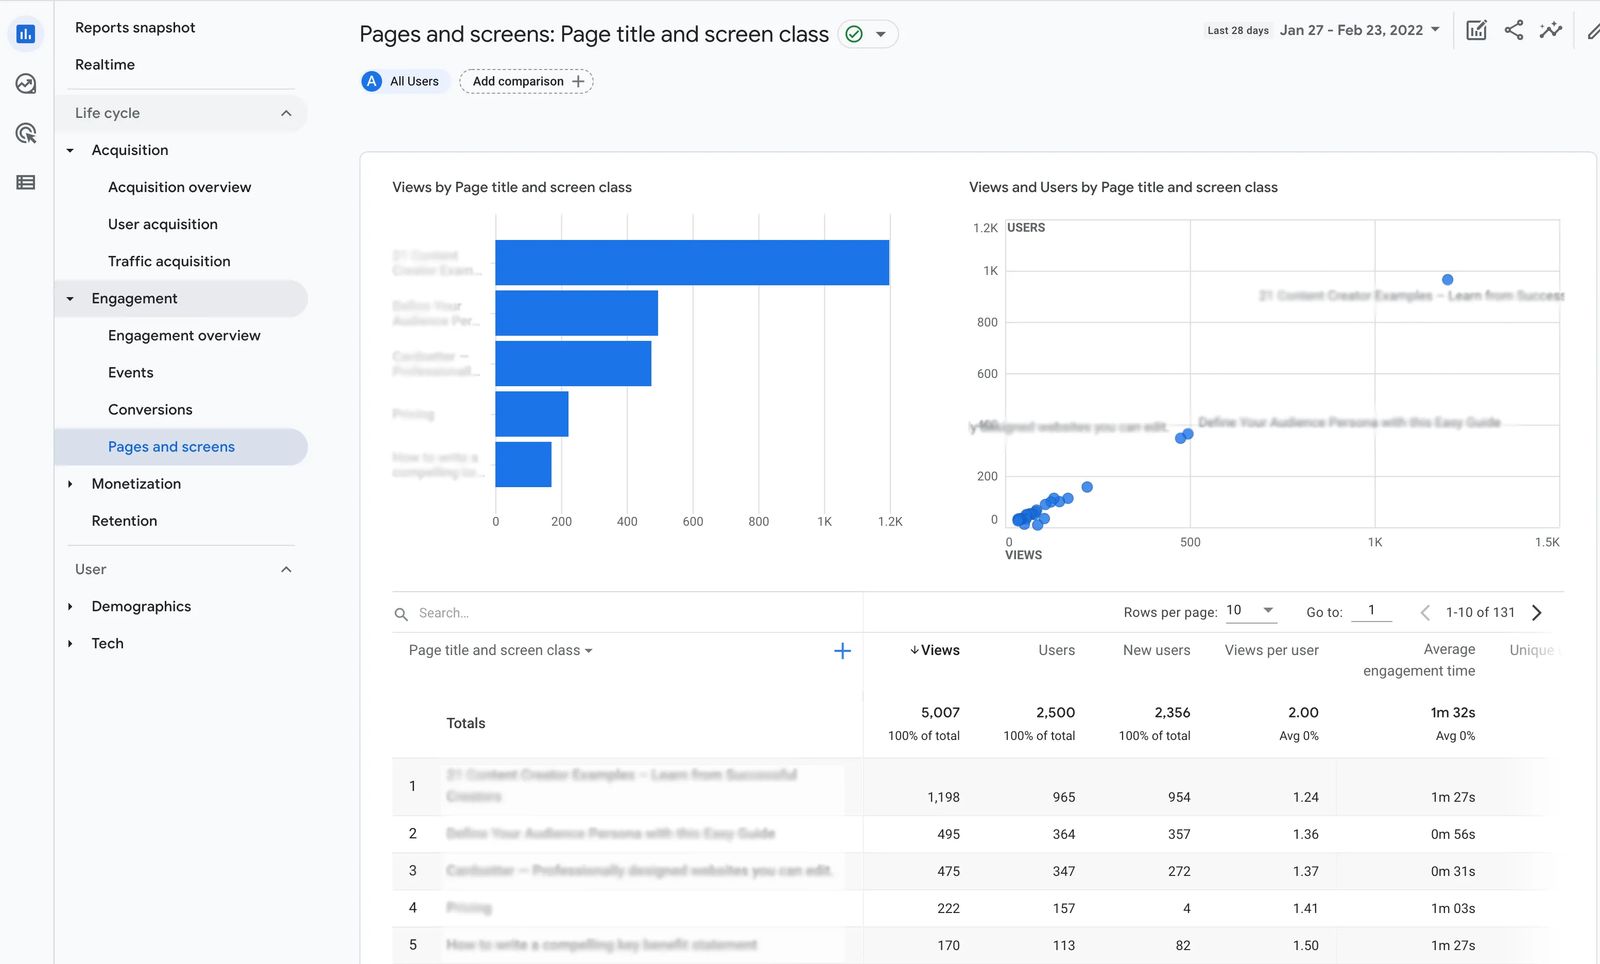
This information can help you determine which blog posts or other resources generate traffic. You can see which product pages are most visited and whether or not people are visiting the pages you believe will help create sales.
Which devices are people using to view my website?
Under the "Tech Overview" report, you can see which browsers, operating systems, and devices are most popular with your website audience.
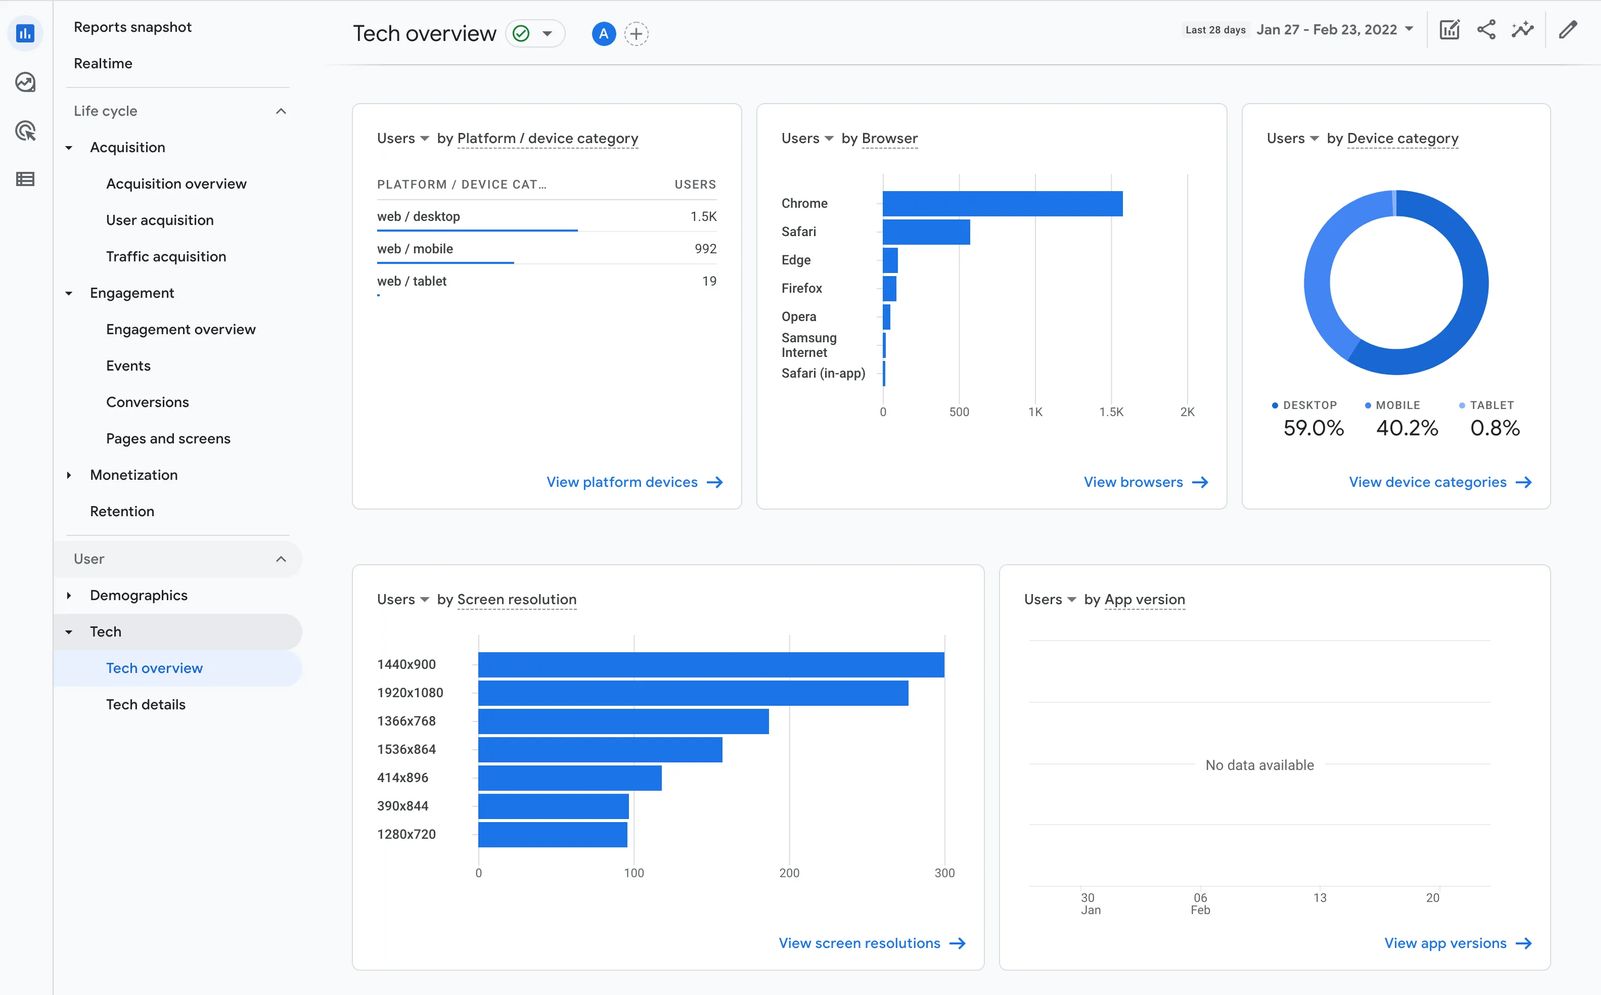
Why is this important? Because if you find that you have an audience using mobile devices instead of desktop, you can optimize your marketing around that fact. You may arrange your website a bit differently when you know the majority of your audience is on the phone vs. desktop. You may also decide only to run your Facebook ads on mobile and exclude desktop ads, for example.
The reports we've listed here will help you get started with Google Analytics. As you become more familiar with the platform, you can explore other reports and advanced settings to go deeper into your website data.
The most important thing to do is make sure that you have Google Analytics installed on your website when it launches. You want to be sure you're collecting this valuable data right away.
Free workbook: Win customers with your website!
Create a strategy to get more leads and sales from your website.